

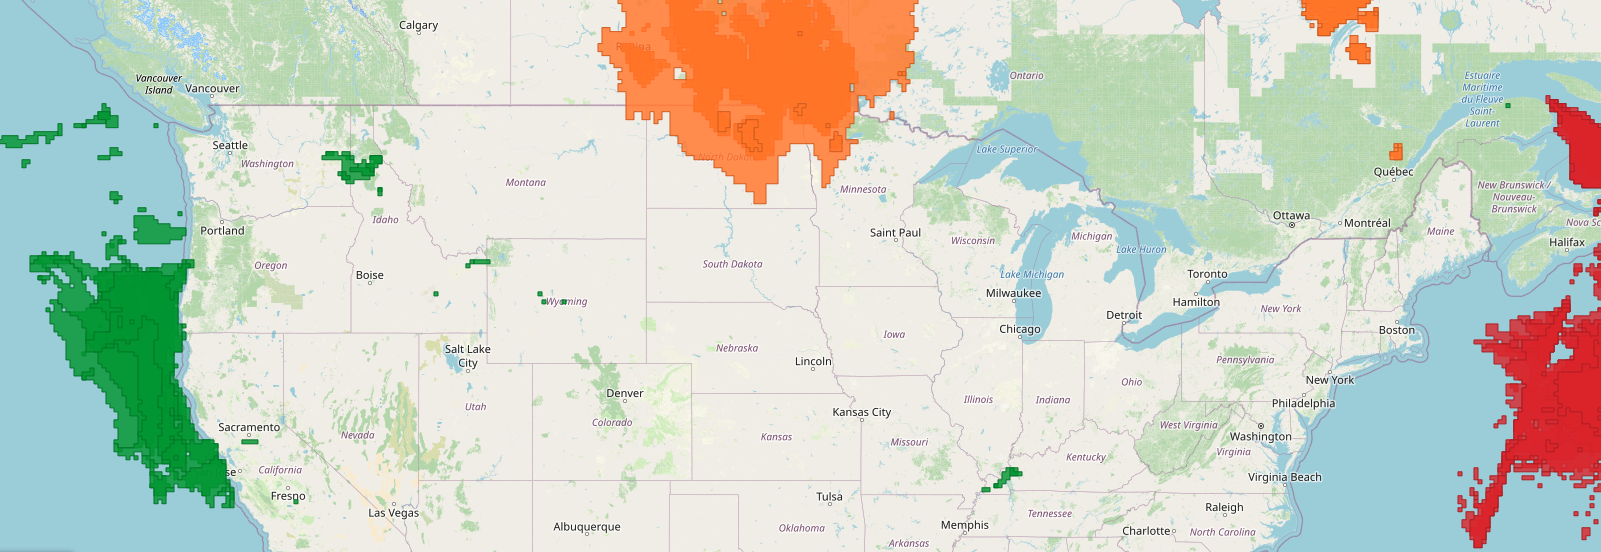
A Custom Vector Events feed quickly aggregates weather events derived from your custom insights—configurable weather thresholds and protocols that you define, or select from a library of industry-popular protocols. With feed settings like refresh rate, resolution, and timeframe, you can tailor how these events are generated to reflect your organization’s unique needs. Once configured, these events can be integrated into any GIS or map-based solution, enabling automated workflows, streamlined decision-making, and provide deeper visibility into weather impacts across your operations.
Custom Events API
A Custom Vector Events (CVE) feed turns your weather thresholds into a stream of ready-to-use geographic events. You define the conditions that matter to your operation — or pick from a library of industry protocols — and the feed continuously publishes the areas where those conditions are met. Because every event is a geometry with metadata, a feed drops straight into GIS and map-based tools to power alerting, automated workflows, and operational visibility.
How it works
A feed is built from one or more monitors, each driven by an insight — a weather threshold such as:
- Wind speed > 8 m/s
- Temperature > 40 °C
- Visibility < 1 mile
Tomorrow.io evaluates these thresholds against the forecast grid. When one or more grid cells exceed an insight's threshold, an event is generated covering the area that crossed it. Grouping several monitors into one feed gives you a single, unified stream of different event types.
Feeds are configured by Tomorrow.io to your specifications — refresh rate, timestep, timeframe, resolution, and area. Once live, the feed is consumed through the public endpoint below. A sample feed named sample is available so you can explore the data structure before your own feed is set up.
The endpoint
POST https://api.tomorrow.io/v4/events-custom/{feedId}.{format}| Path param | Required | Description |
|---|---|---|
feedId | yes | Your feed's id (e.g. sample). |
format | yes | json or geojson. |
Fetch all events from the sample feed:
POST https://api.tomorrow.io/v4/events-custom/sample.json?apikey=YOUR_KEY
POST https://api.tomorrow.io/v4/events-custom/sample.geojson?apikey=YOUR_KEY
Send the request with no body to return everything in the feed, or add a body to filter (see Filtering events).
Response formats
Pick the format that matches your use case:
| Format | Shape | Best for |
|---|---|---|
.json | An events array of event objects with full metadata. | Programmatic analysis and business-workflow integration. |
.geojson | A FeatureCollection of Feature objects, each with a geometry and properties. | Mapping, visualization, and GIS platforms (GeoJSON spec). |
The two formats carry the same information; only the structure differs.
JSON sample response
{
  "events": [
    {
      "id": 0,
      "object_key": "0738ee6491d6a1de7e5c0c6c592ae9r0",
      "start": "2025-01-06T00:00:00Z",
      "end": "2025-01-07T00:00:00Z",
      "locations": [
        {
          "geojsonGeometry": {
            "type": "Polygon",
            "coordinates": [
              [
                [-63.80859374999999, 52.277379792414685],
                [-63.6328125, 52.277379792414685],
                [-63.6328125, 52.38482863733332],
                [-63.80859374999999, 52.38482863733332],
                [-63.80859374999999, 52.277379792414685]
              ]
            ]
          }
        }
      ],
      "attributes": {
        "accountId": "7436tf07f72afr651e2480fg5tg9f",
        "insightId": "c216753-3fbc-4454-9c48-3dec743b4210",
        "insightName": "6 Hour Snow Accumulation",
        "locationId": "us_continental",
        "severity": "severe"
      }
    }
  ]
}
GeoJSON sample response
{
  "type": "FeatureCollection",
  "features": [
    {
      "type": "Feature",
      "geometry": {
        "type": "Polygon",
        "coordinates": [
          [
            [-114.60937499999999, 45.834886584131745],
            [-114.43359375, 45.834886584131745],
            [-114.43359375, 45.957348270500816],
            [-114.60937499999999, 45.957348270500816],
            [-114.60937499999999, 45.834886584131745]
          ]
        ]
      },
      "properties": {
        "start": "2025-01-07T00:00:00Z",
        "end": "2025-01-07T01:00:00Z",
        "accountId": "6630ee07f72add651c560f3b",
        "insightId": "211e7292-4099-48ac-8371-c2fbf1bfc54e",
        "insightName": "6 Hour Snow Accumulation",
        "locationId": "us_continental",
        "severity": "severe",
        "insightDescription": "Heavy snow accumulation of more than 6 inches expected"
      }
    }
  ]
}
The event object
Each event describes one weather occurrence — when it happens, where, and why.
| Field | Type | Description |
|---|---|---|
start | string (ISO 8601) | UTC start time, YYYY-MM-DDTHH:mm:ssZ. |
end | string (ISO 8601) | UTC end time. |
locations / geometry | object | The affected area, as a GeoJSON polygon. (locations[].geojsonGeometry in JSON; geometry in GeoJSON.) |
attributes / properties | object | Event metadata (see below). |
Metadata fields inside attributes (JSON) or properties (GeoJSON):
| Field | Description |
|---|---|
insightId | Unique ID of the insight that triggered the event. |
insightName | Name of the insight, as defined in the platform or via API. |
insightDescription | Human-readable description of the insight. |
locationId | Identifier for the feed's location category, assigned by Tomorrow.io. |
severity | Severity level defined in the insight. |
triggerValues | The actual weather conditions that caused the trigger (see Why an event triggered). |
Why an event triggered
Two parts of the event tell you why it fired and how intense it was:
- The geometry is the area where the threshold was exceeded — the union of the grid cells that crossed your insight's condition.
triggerValuesare the weather conditions inside those triggering cells. They're computed only from the cells that exceeded the threshold, so they describe the part of the area that actually drove the event — not the surrounding region.
Each entry in triggerValues names a field and summarizes its values across the triggering cells using the same min / max / avg convention used elsewhere in the API:
"triggerValues": [
  {
    "field": "temperature",
    "min": 40.01,
    "max": 42.84
  }
]
For an insight of temperature > 40 °C, this says the coolest triggering cell was 40.01 °C and the hottest was 42.84 °C — every cell in the event area was above your threshold, and the spread shows how far past it conditions reached.
Use triggerValues to:
- Understand why an insight fired.
- Measure event severity and proximity to your thresholds.
- Evaluate threshold performance against operational decision criteria.
Filtering events
Add a JSON body to narrow the response. Filters can be combined.
By time — provide a timeRange with from, to, or both (ISO 8601):
{
  "timeRange": {
    "from": "2025-01-02T00:01:00Z",
    "to": "2025-01-02T23:59:00Z"
  }
}
By area — provide a geofence as a GeoJSON geometry; only events intersecting it are returned:
{
  "geofence": {
    "geojsonGeometry": {
      "type": "Polygon",
      "coordinates": [
        [
          [-104.70273345194833, 43.89808150147567],
          [-104.70273345194833, 40.51070838161783],
          [-95.90647971392198, 40.51070838161783],
          [-95.90647971392198, 43.89808150147567],
          [-104.70273345194833, 43.89808150147567]
        ]
      ]
    }
  }
}
By attributes — provide an attributes map of attribute name → value. For example, to return only events from one insight:
{
  "attributes": {
    "insightId": "d3dabf22-9877-4688-b2b9-e71eaf521838"
  }
}
Working with large feeds
A feed covering a large area or a long timeframe can return a high volume of events in a single response. Two ways to keep responses manageable:
- Narrow the request first- The
timeRange,geofence, andattributesfilters above are the most effective way to cut a CVE response down to what you actually need. - Page through large result sets- See Pagination for Tomorrow.io's cursor-based pagination model.
Related
- Pagination — handling large result sets.
- Custom Vector Events API reference — endpoint schema and try-it console.
- GeoJSON specification — for consuming the
.geojsonformat.